Every time you save a photo as a JPEG, part of it is deleted permanently. Edit that photo and save it again, and the deletion happens in a different place at a different strength, which is exactly the crack forensic tools pry open. Understanding how JPEG compression works is what turns Error Level Analysis from a colorful mystery picture into something you can actually read. Below is what the format does to your pixels, why an edit leaves a signature your eyes cannot catch, and where this whole approach stops working.
Every JPEG Starts by Deciding What Your Eyes Will Not Miss
JPEG is not a general purpose compressor. It is built on two facts about human vision: we notice changes in brightness far more than changes in color, and we notice broad shapes far more than fine texture. The format spends its bits where you are paying attention and rounds off everything else. That is how a 25MB camera file becomes a 3MB JPEG that looks identical at normal viewing size.
The trade is permanent. Discarded detail does not come back when you save at a higher quality later, you just get a bigger file wrapped around the same missing information. Bad news for image quality. Very good news for anyone trying to work out what happened to a picture.
A JPEG is not a copy of your photo. It is a set of instructions for rebuilding something close enough to fool you.
How JPEG Compression Works: Five Steps From Photo to File
Every save runs the same pipeline, and only one step in it actually loses anything. Knowing which step that is explains almost every artifact you will ever see in an error map.
Color conversion. Red, green, and blue get rewritten as one brightness channel and two color channels.
Chroma subsampling. The two color channels are shrunk, usually to a quarter of their resolution, because your eyes will not miss it.
Blocking and transform. The image is cut into 8x8 pixel tiles, and each tile becomes 64 numbers describing how much of each wave pattern it contains, from flat gradients up to fine checkerboards.
Quantization. Each of those 64 numbers is divided by a value from a quality table and rounded to a whole number. Fine detail gets big divisors, rounds to zero, and vanishes. This is the lossy step, and it is the only one.
Packing. Whatever survives gets reordered and squeezed with lossless coding.
Step four is where the forensic story begins. Rounding is a one way door, and the size of the divisor decides how much goes through it.
The Quality Slider Is Really a Table of Divisors
When you drag a quality slider from 90 down to 60, you are not adding blur. You are swapping in a table of larger divisors. More coefficients round to zero, the file gets smaller, and each 8x8 tile gets rebuilt from fewer ingredients. Push it far enough and neighboring tiles stop agreeing at their edges, which is the blocky, smeared look everyone recognizes from an over-compressed meme.
Here is the part most explainers skip. Those tables are fingerprints. Camera makers, phone makers, and editing programs each ship their own quantization tables, and the differences are readable straight out of the file. A photo that claims to be untouched from a particular phone but carries the table signature of a desktop editor has been through that editor, whatever the caption says. A free tool called JPEGsnoop has been matching these signatures against a database of known devices and software for years.
Why the Second Save Hurts Less Than the First
The photocopy-of-a-photocopy story is mostly wrong. Reopen a JPEG and save it again at the same quality with no other changes, and the coefficients are already sitting exactly on that quantization grid, so rounding them a second time returns nearly the same numbers. A little drift creeps in from the color conversion math, but the file settles instead of crumbling.
Two things break that stability, and both matter for detection. Changing the quality setting pushes every block through a different set of divisors. Shifting the grid does something worse: crop a JPEG by an amount that is not a multiple of eight pixels and every block boundary moves, so data already flattened for one grid gets flattened again for a new one. Resizing does the same thing across the entire frame.
Want to see it? Save a photo at quality 85, crop three pixels off one edge, save again at quality 85, and compare error maps. The whole frame changes, not just the crop edge. This is also why an honest photo that a news desk cropped and resaved can look suspicious under analysis. Compression damage tells you a file was processed. It never tells you why.
What Happens When You Paste Something Into a JPEG
Think of compression history as an odometer. Every region of an untouched photo shows the same reading. An edit rolls part of it back toward zero.
Picture a photo saved once at quality 85. You open it, paste in a face taken from a different image, and save at quality 85 again. The untouched areas meet the same grid with the same divisors and barely move. The pasted region is meeting this table for the first time, still carrying detail this quality setting is about to destroy, so it changes far more on this save than everything around it.
There is a related trick worth knowing. If a pasted patch originally came from a more heavily compressed source, resaving the whole image across a sweep of quality settings makes that patch dip in error at its original quality while the rest of the frame does not. Researchers call it a JPEG ghost, and Hany Farid's academic work on image forensics is where the method comes from. The difference is far too small to see. It is not too small to measure.
An edit does not just change pixels. It resets the compression history of everything it touches.
The 8x8 Grid Almost Never Lines Up With Your Edit
Error levels are only half the evidence. The 8x8 grid leaves a faint lattice in every JPEG, and that lattice is very hard to fake convincingly.
A region pasted in from another file arrives carrying its own lattice from its own compression history. Unless it lands on an exact multiple of eight pixels in both directions, which basically never happens by accident, you end up with two overlapping grids where there should be one. Analysts call this a block artifact grid mismatch, and at high zoom it appears as a faint rectangular seam that follows nothing in the actual scene.
Resizing scrambles the lattice differently. Scale a pasted patch by 1.3x and its old block boundaries stop sitting 8 pixels apart, so the pattern falls out of step with the host image in a way that stays measurable long after it stops being visible. Clone and healing tools leave the opposite fingerprint: the copied area shares an identical block pattern with wherever it was copied from, which is precisely what copy-move detection hunts for.
What Error Level Analysis Is Actually Showing You
ELA does one thing. It resaves your image at a known quality, usually around 95, then shows the difference between that new version and the file you supplied. Areas already flattened by earlier compression have little left to lose, so they barely change and come back dark. Areas still carrying detail change more and come back bright. Security researcher Neal Krawetz popularized the technique, and he has spent years pointing out that people read his own tool far too aggressively.
Brightness is not guilt. Sharp edges, text, and fine texture always show high error because they hold the high frequency detail compression attacks first. Flat sky, skin, and blurred backgrounds always show low error. Comparing a bright edge against a dark patch of sky proves nothing at all.
Read it by comparing like with like: two patches of sky, two faces, two areas of grass. You are hunting for one region behaving differently from other regions of the same kind. In my experience, most bad ELA readings come from people expecting the edit to glow white against a black frame, then declaring an image clean when it does not.
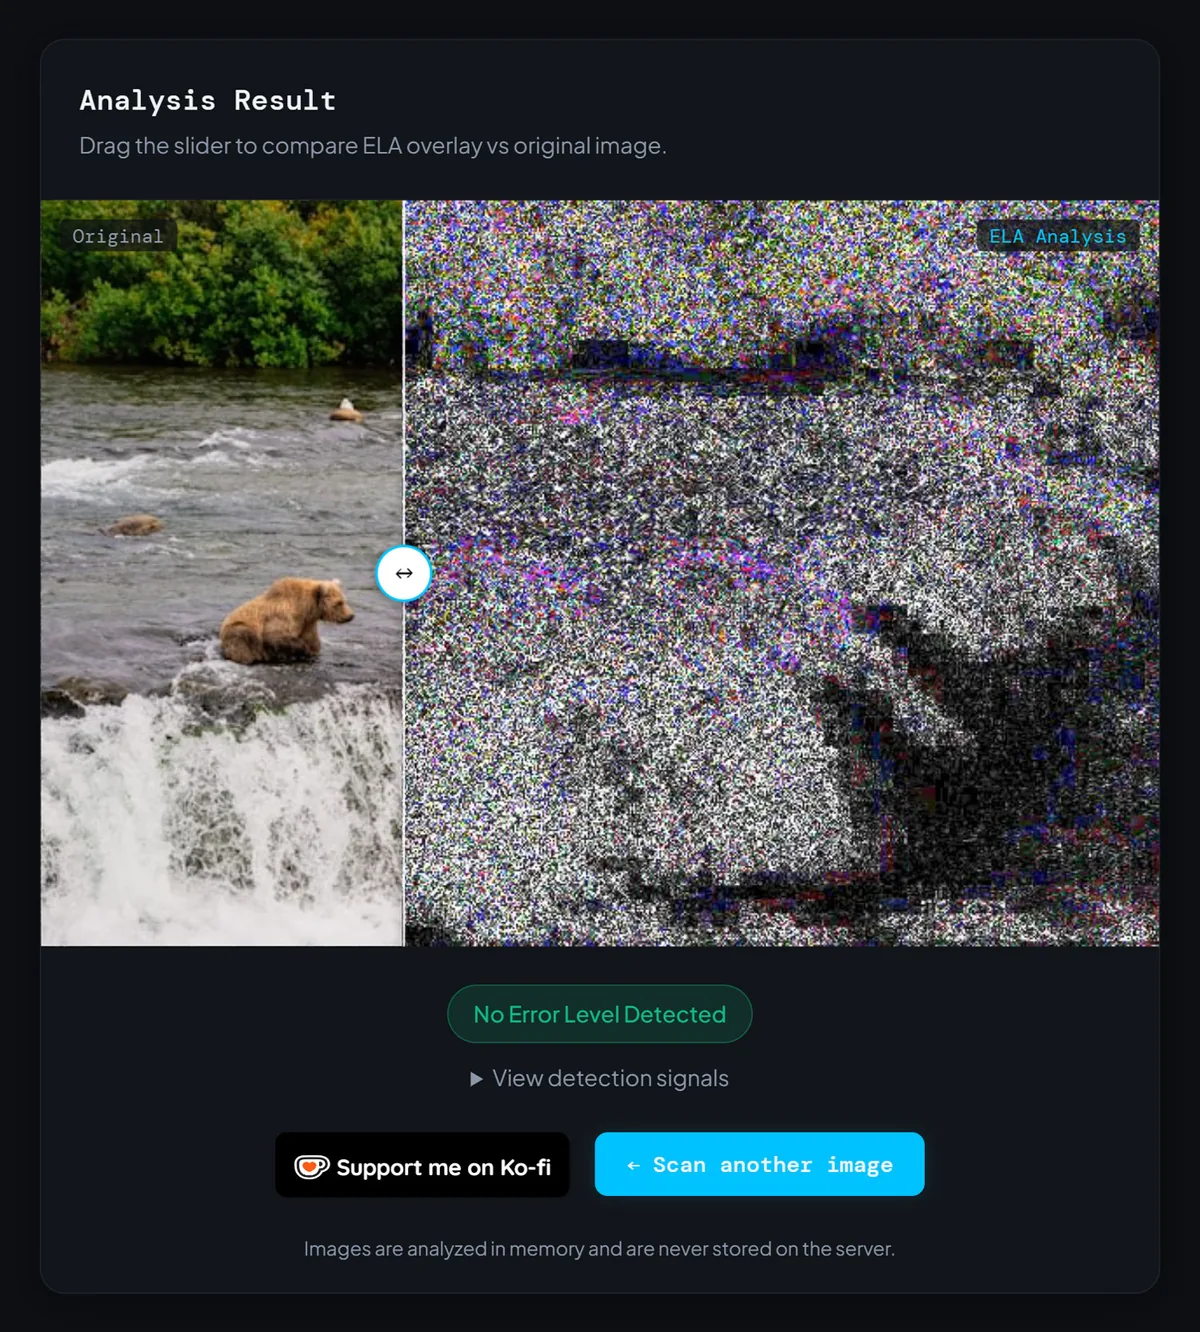
The fastest way to make any of this stick is to stop reading and run a file whose history you already know. Save a photo at quality 85, paste something into it, save again at the same quality, then upload both versions to the scanner on this site and put the two error maps side by side. Five minutes of that beats another thousand words from me.
Where JPEG Forensics Falls Apart
Every technique above depends on the file still carrying its compression history. Plenty of ordinary things erase it, and knowing which ones will save you from confident wrong conclusions.
A screenshot is the worst offender. It re-renders everything on screen into one fresh image with one quality setting and one grid, so an edited region and its background arrive at the analysis with matching histories. Social platforms come close behind, since most resize and recompress on upload while stripping metadata on the way through. A photo that has passed through a group chat, a repost, and a download has been laundered.
Heavy compression is another dead end. Push quality low enough and every region hits the floor together, flattening real differences into nothing. Lossless formats fail for the opposite reason: run ELA on a PNG and the whole frame comes back bright, because there is no earlier quantization to compare against. That is the tool reporting no history to read, not a verdict of fake.
Why AI-Generated Images Break the Usual Rules
Compression forensics was designed for a world where fakes were assembled from real photographs. AI images are not assembled. A model outputs a complete frame in one shot, with no paste, no seam, and no earlier compression anywhere in it.
Save that output to JPEG once and every pixel meets the quantization table at the same moment. The error map comes back smooth and even, which is exactly what a clean single-save camera photo looks like too. ELA was never built to answer this question, and treating an even error map as a clean bill of health is how people get fooled.
Compression still contributes something, just indirectly. Real sensors produce fine grain noise, and noise is expensive to compress, so it survives as a busy, even texture across the frame. Many generated images lack it, leaving unusually smooth regions that compress too well and read as plasticky. Across the generated images I have run through this scanner, that flat-noise pattern shows up far more often than any localized bright patch does.
I have tested 50 AI generated images and about 68% of them had unnaturally smooth and low-noise areas. Only 19% had clear localized compression artifacts, and some images had both characteristics.
Order matters more than tooling. This is the sequence I use, and it deliberately puts the cheapest, fastest checks first.
Get the most original copy available, not a screenshot and not a social download.
Read the metadata. Camera make and model, lens, timestamps, GPS, and above all the software field. An editor named there often answers the question before you run anything else.
Check the quantization tables against what the claimed camera should produce.
Run ELA, comparing matching surfaces only.
Zoom to 400 percent along suspicious boundaries and look for a rectangular seam, doubled edges, or color fringing that does not match the rest of the frame.
Check the story. Reverse image search for earlier and larger copies, then see whether the caption survives contact with the original.
No single step is proof, and any single step can mislead you. Compression evidence is a reason to keep looking, and the strongest cases are the ones where metadata, error levels, grid alignment, and the picture's history online all point the same direction. In the files people send me, the most common finding is not a forgery at all. It is an honest photo that got cropped, resaved, and pushed through two messaging apps.
In my own testing, I've seen original camera photos produce misleading compression patterns after just a few rounds of editing and messaging-app uploads, despite containing no fake or AI-generated content.
Questions People Ask About JPEG Compression and Edits
Does saving a JPEG over and over destroy the image?
Can Error Level Analysis prove a photo was edited?
Why does my ELA result look bright everywhere?
Does JPEG quality 100 mean no loss?
Compression Is a Paper Trail, If You Know How to Read It
JPEG discards detail in a specific, predictable pattern: 8x8 blocks, frequency coefficients, a table of divisors, and a great deal of rounding. Because the pattern is predictable, anything that breaks it stands out. An edited region carries a different compression history, a misaligned grid, or both, and those differences outlive the visual evidence by a long way.
None of it is proof on its own, and anyone selling you a single-click verdict is overselling. What compression gives you is a reason to look harder at one part of a picture instead of squinting at all of it.
Here is your next step, and it takes about two minutes. Upload a JPEG whose history you already know, read what the error map and the detection signals say about it, then upload the one you actually have questions about. Reading the second image gets much easier once you have seen what the first one looks like.